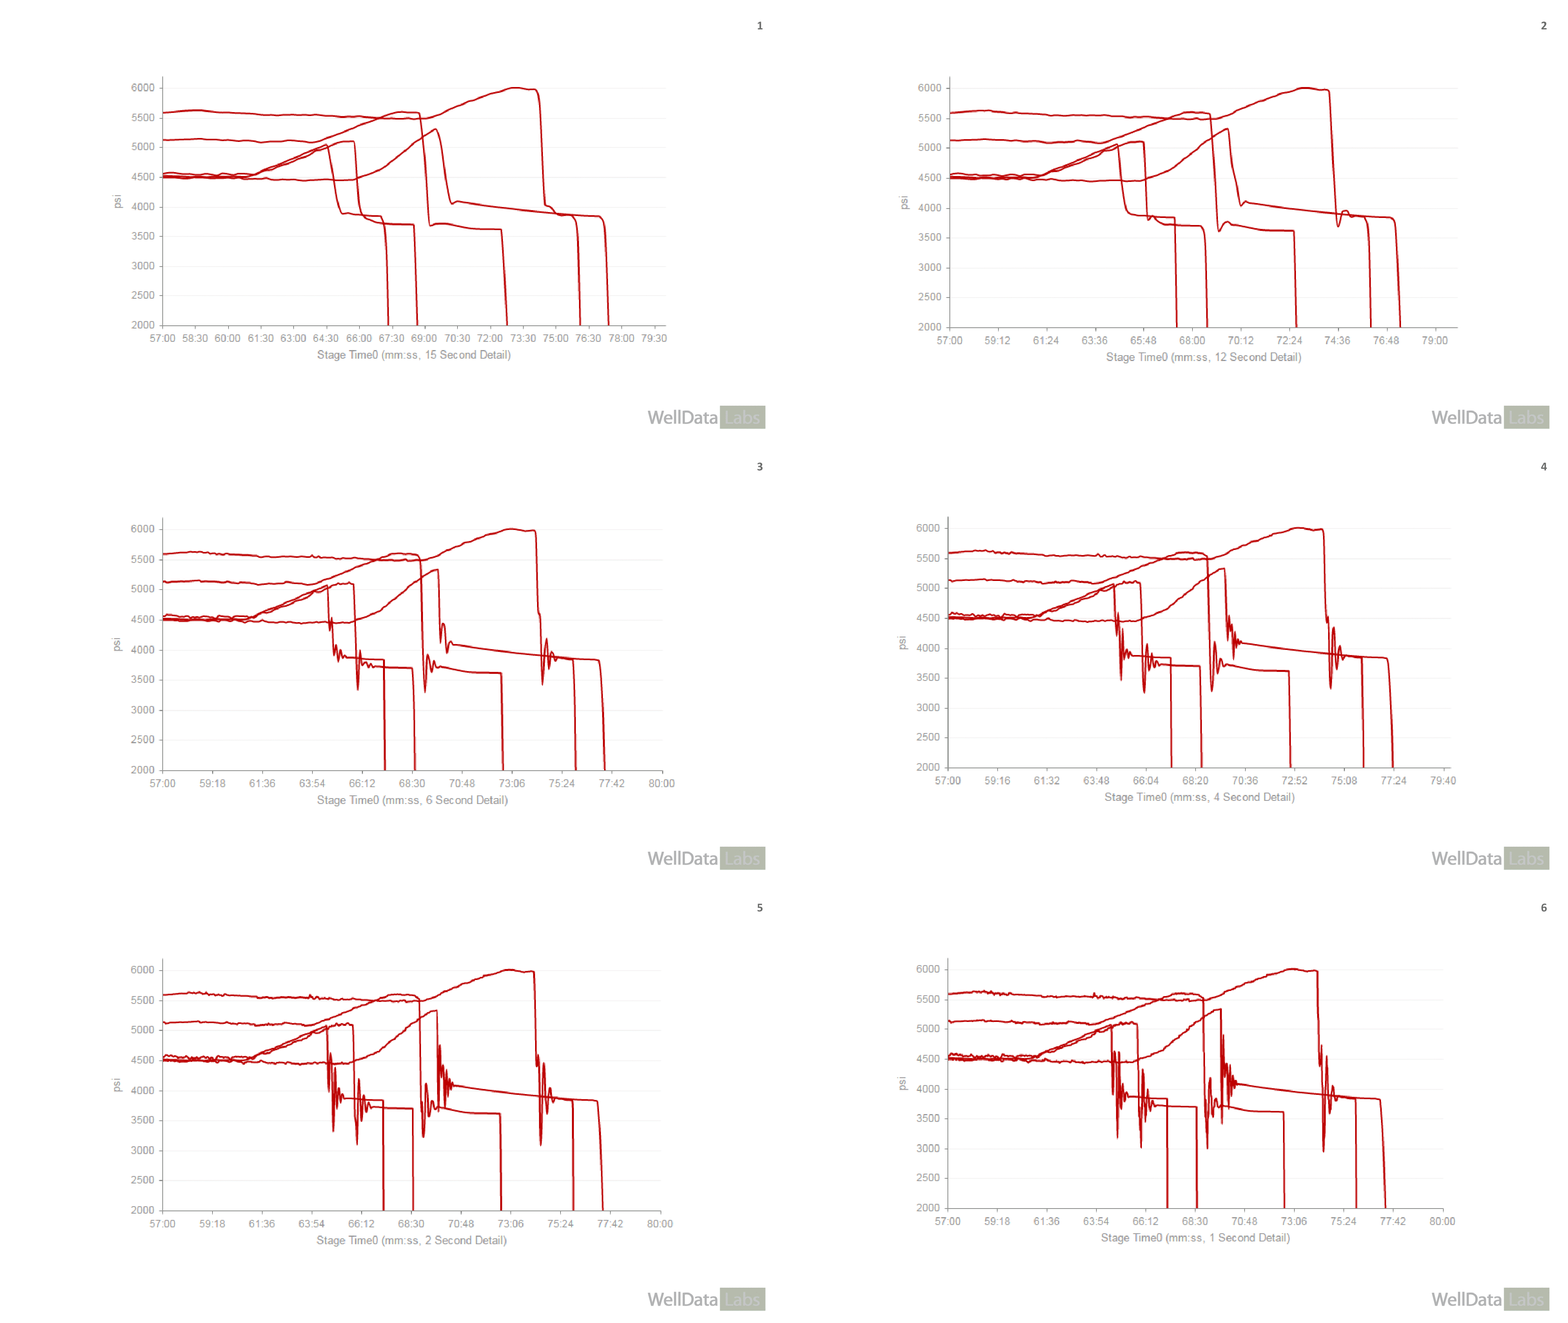
Data Resolution – Why is it important?
New software is allowing companies to capture and store more granular data than ever. In O&G, specially in completions operations, some of the most detailed data is acquired off field equipment at a one-second level. These operations generate gigantic files that usually end up sitting on an operator’s share drive and rarely used, yet they have an immense potential for answering challenging questions.
Although data is considered the oil of the digital era, more data does not automatically translate into better analysis. Anyone who has opened a post-frac one-second CSV knows this all too well. Quality data delivery has not historically been a priority in completion jobs and has resulted in a mishmash of static post-job reports and unknown-quality one second data. Analyzing a pressure signal using static reports or data with the wrong frequency can not only be misleading, but also time-consuming and tedious. In addition to the lack of consistency among vendors, hydraulic fracturing pressure data is subject to several limitations. Some of these include signal interference introduced by wellbore geometry, rate variations, fracturing fluid composition, and low sampling frequency.
Recent studies show that data scientists spend around 80% of their time on preparing and managing data for analysis. Making quality data delivery a priority and having standardized reports would eliminate most of the work invested in cleaning up and formatting old files to make them compatible with modern software. Overcoming these challenges can actually be relatively easy, once engineers truly understand the value of high-frequency data.
Having the ability to view high frequency data can lead to insights across industries. In Flash Boys (2014), Michael Lewis tells the story of the high frequency trading revolution on Wall Street. Analysts looking at the trading activity over of a single stock on a ten minute chart divided into one second increments would see frenetic activity; every second packed with puts and calls, buys and sells. But zoom into a one second chart divided into milliseconds and you’d see all that activity jammed into the first 1.78 milliseconds. The graph would look like a single obelisk standing over a flat plane. Minute by minute the stock market appears to be a hive of never ending activity, but in reality, nearly 98% of the time it’s open the stock market is quiet.
Making decisions based on bad data
For petroleum engineers to be able to ask more questions and make better decisions with vast amount of accessible data, the first step is to improve its quality. For instance, my review of an extensive database of one-second fracture treatment data revealed distinct water hammer signatures from the treating pressure plots of stages placed in similarly completed wells. Ideally, a diagnostic evaluation of a water hammer signature following a fracture treatment stage could provide immediate feedback on stage effectiveness. However, low frequency data (e.g. 5, 10, or 15 second frequencies) can mask what the water hammer signal can say about the system or the treatment performance. Current studies may even show that a 10HZ or 100HZ sampling is necessary to analyze pressure signal. A similar issue is observed on pressure data obtained from downhole gauges during well shut-ins. Well testing and long-term monitoring data requires a minimum sampling frequency so the raw data is accurate for further analysis, like obtaining formation permeability, pressure, and drainage area.
Improving data quality and resolution significantly enhances the productivity of analytics teams by reducing the time they would previously spend to validate and fix data. High-frequency data aggregation and distribution is already taking place in the drilling world to ensure that people on the rig and in the office are able to act on the data. Real-time displays and reports and a properly designed data-aggregation and distribution system allows access to real-time models and algorithms for analysing optimal drilling practices.
These days, more operators and oilfield service companies are prioritizing data delivery and storage processes, which will lead to large sets of high quality, detailed data. High-frequency data provides unique ways to understand the causes of a particular behavior in a frac treatment (like pressure), helping to directly approach or solve challenging issues. One second completions data just happens to be my focus right now, but I am completely convinced that there are significant opportunities for advancement to be found throughout the industry, simply by finding ways to collect and manage higher frequency data samples. If you are working with high frequency time series data of any sort, I’d love to hear how you are dealing with it and what you are learning!

